Browse these Soil Health Data resources from our mentor network
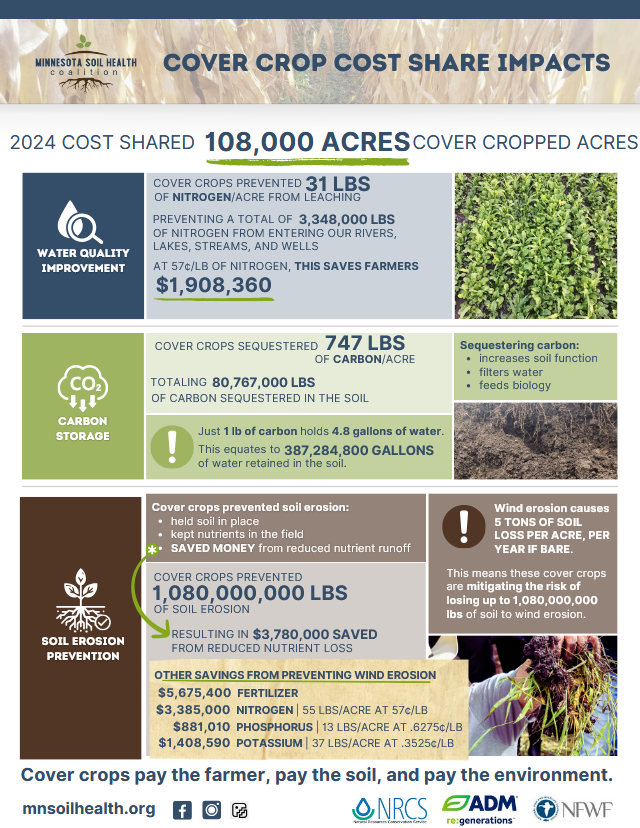
2024 Cover Crop Cost Share Impacts
In 2024, over 108,000 acres of Minnesota farmland were cover cropped through cost share programs – protecting soil, improving water quality, and capturing carbon across the state.
- Water Quality Improvement: Cover crops prevented 31 lbs of nitrogen per acre from leaching, saving farmers and estimated $1.9 million while keeping nutrients out of rivers and lakes.
- Carbon storage: An estimated 80 million pounds of carbon were sequestered – improving soil health, water retention, and biological activity.
- Soil erosion Prevention: Cover crops held back over 1 billion pounds of soil erosion, saving an additional $3.7 million from reduced nutrient losses and erosion.
- Cover crops pay the farmer, pay the soil, and pay the environment.
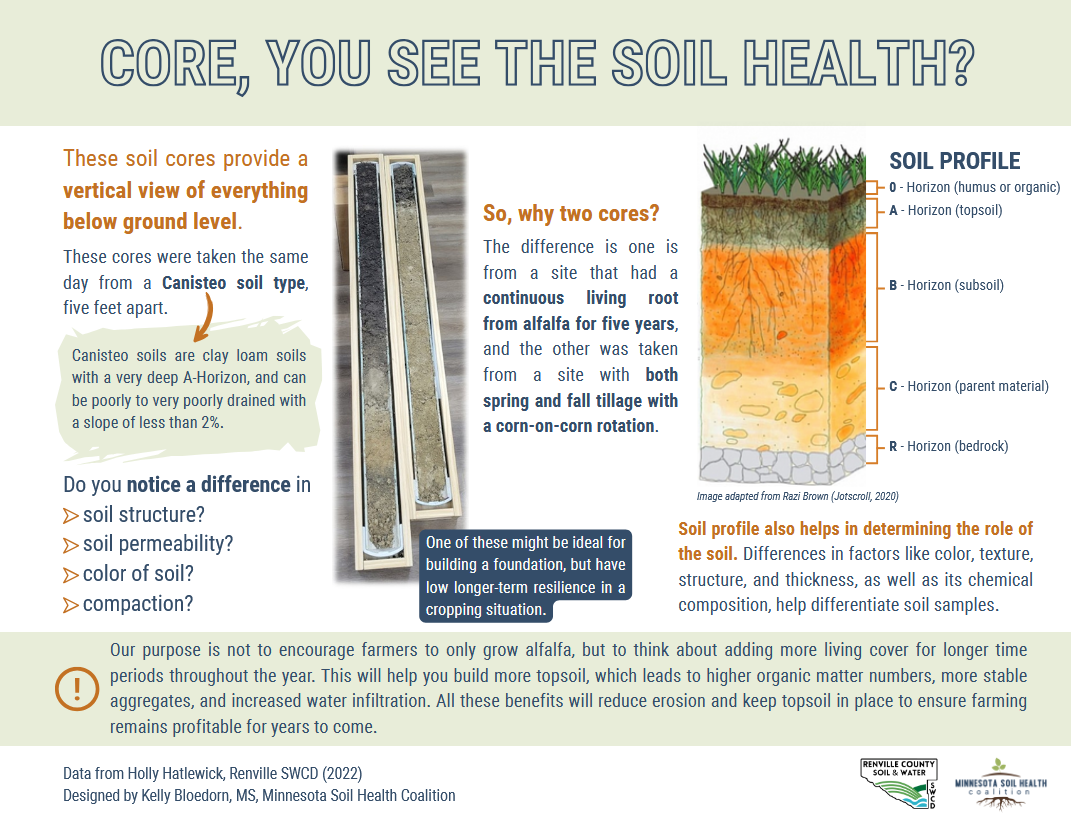
Core, you see the soil health?
This visual comparison of two soil cores shows how management impacts soil health below the surface. One core came from a field that had a continuous living root from alfalfa for five years, the other was from a site with both spring and fall tillage with a corn-on-corn rotation. The difference in structure, color, texture, and thickness help differentiate soils samples.
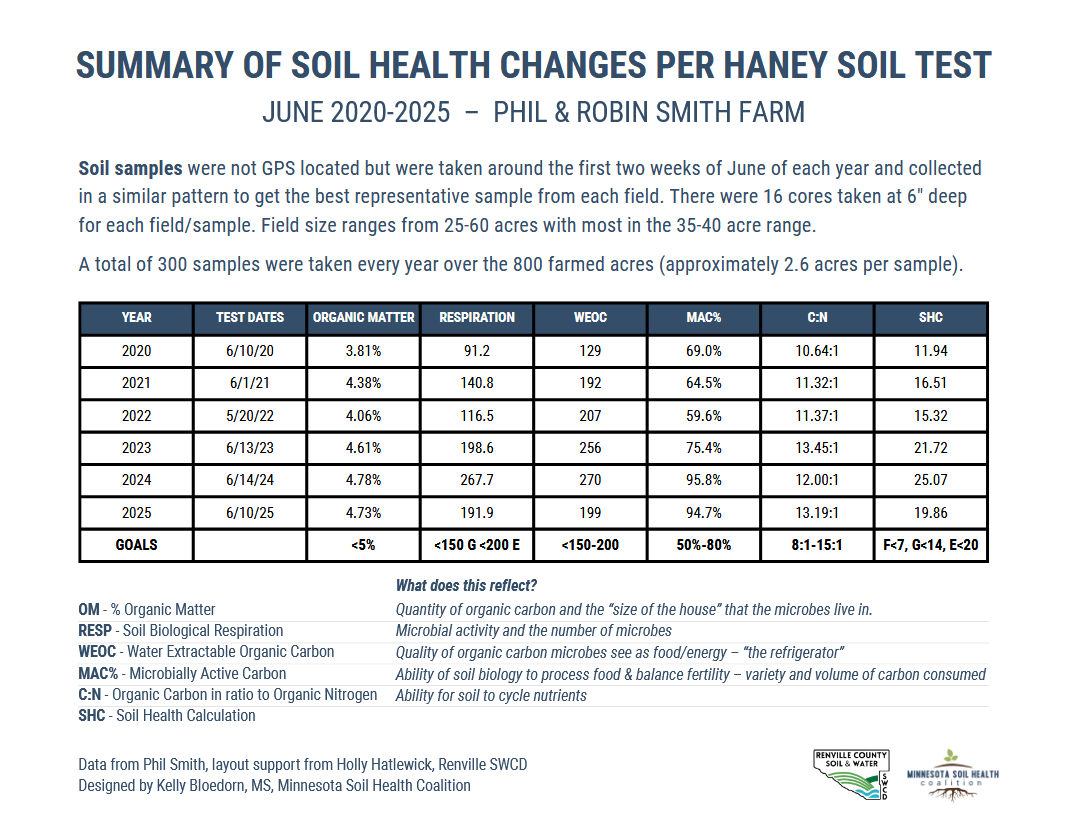
A Summary of Soil Health Changes
Five years of Haney Soil Test data from one of our mentors Phil & Robin Smith’s Farm show steady improvements in soil biology and organic matter across 800 acres. Organic matter rose from 3.81% to 4.73%. Soil Respiration & Carbon activity more than doubled. These results help prove that regenerative management builds healthier, more resilient soils over time.
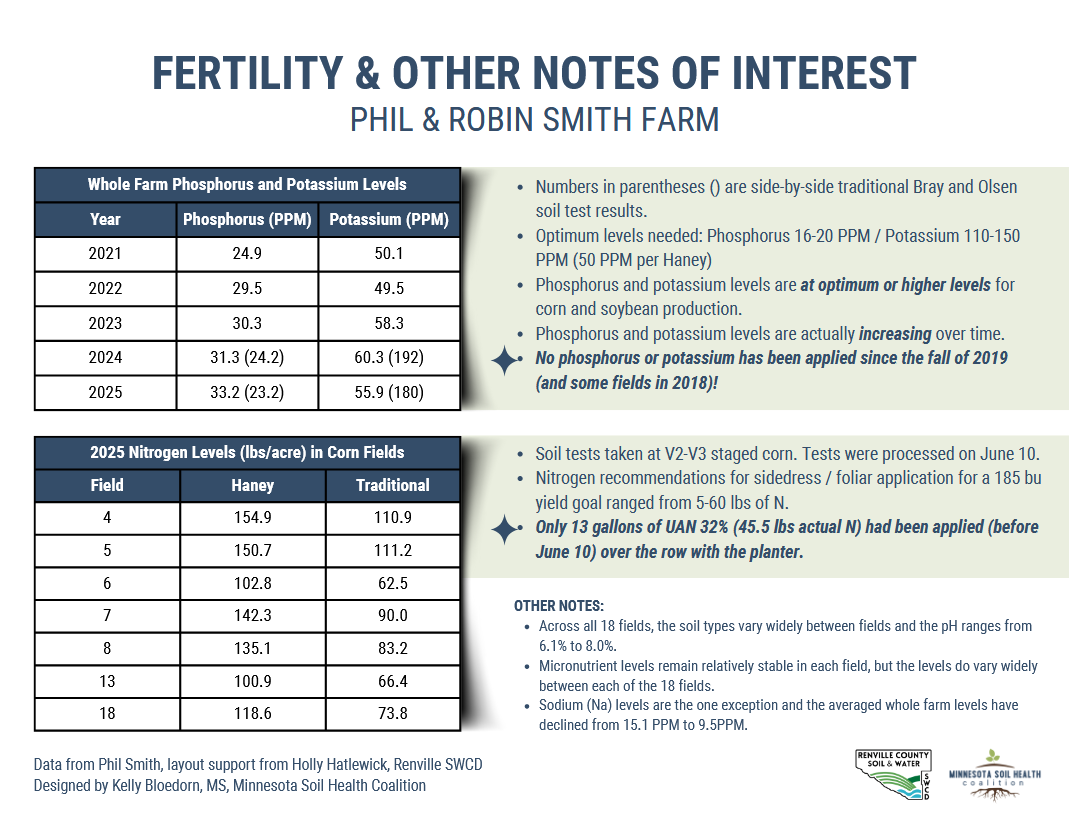
Fertility & Other Notes of Interest
Phosphorus and potassium levels remain strong and continue to rise, even without added fertilizer since 2019. Nitrogen levels show efficient nutrient cycling, supporting healthy productive soils.
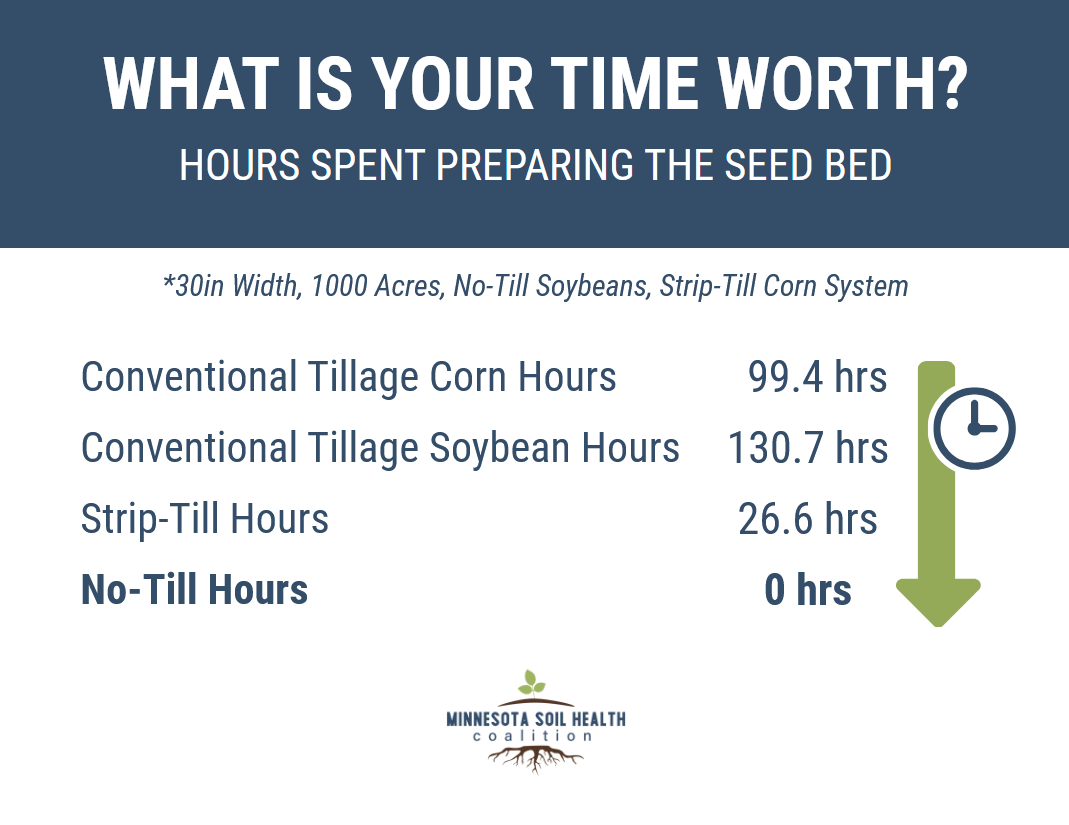
What is your time worth?
This sheet shows just how much time different tillage systems demand when preparing the seed bed. Farmers using conventional tillage spend nearly 100-130 hours prepping for corn and soybeans – while strip-till drops that to just 26 hours, and no-till brings it all the way down to zero. Less time in the tractor means lower fuel costs, less wear on equipment, and more time to focus on what matters most.
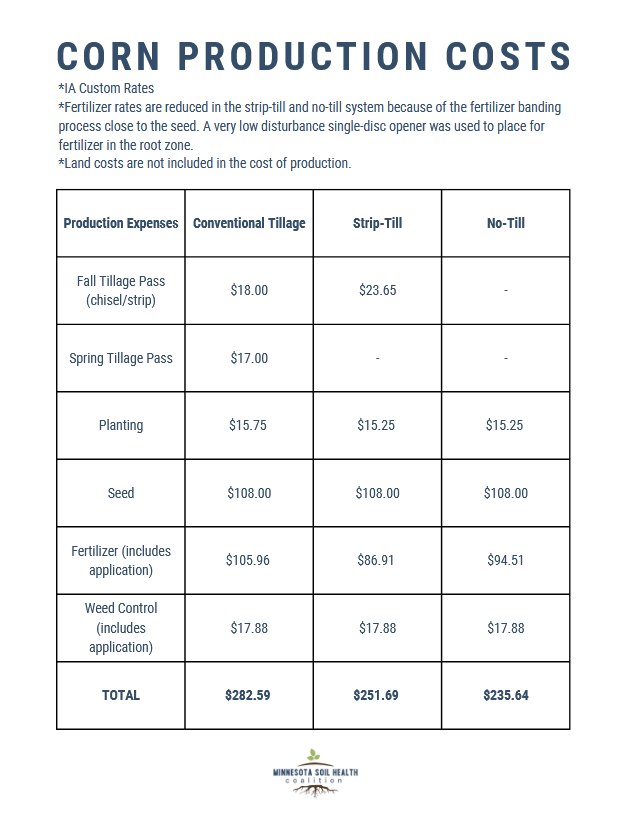
Corn Production Costs
This sheet compares average Iowa custom rates for conventional tillage, strip-till, and no-till corn production – showing how reduced tillage translates directly to lower input costs. Farmers using no-till save nearly $47 per acre compared to conventional tillage while maintaining comparable yields. Fewer passes mean less fuel, labor, and wear on equipment – and healthier soils in the process.
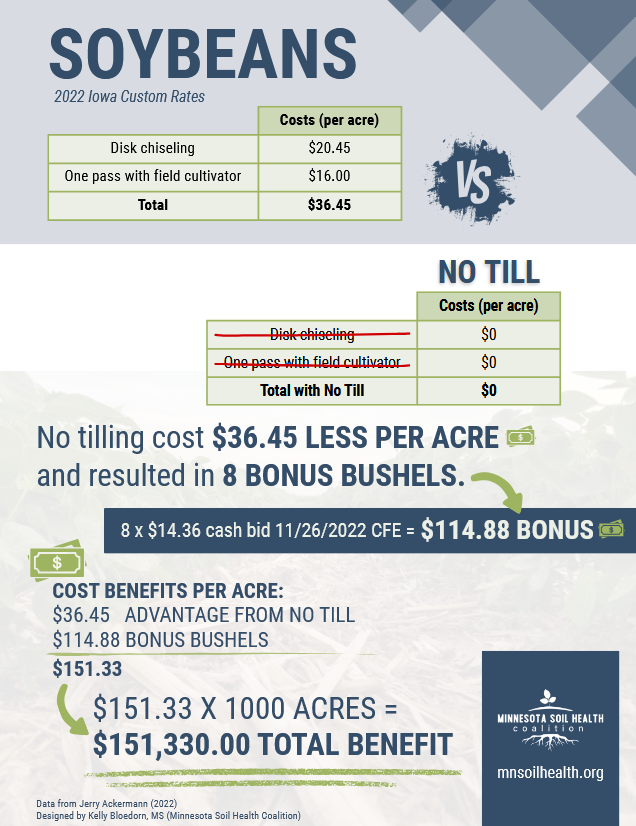
No Till Soybeans
This flyer, from one of our members, breaks down the economic benefits of switching from conventional tillage to no-till practices for soybean production. Using 2022 Iowa Custom Rates, the breakdown shows that eliminating tillage can save $36.45 per acre while producing 8 bonus bushels per acre, resulting in a total advantage of $151.33 per acre. A 1,000 acre operation could see a total benefit of over $151,000 proving soil health practices can pay off.
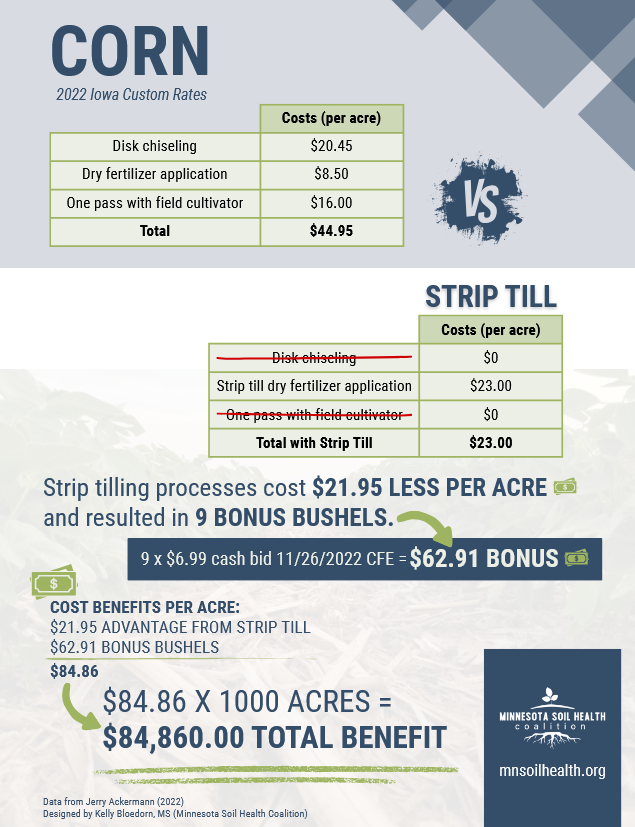
Strip Till Corn
This comparison shows the difference in costs and returns between conventional tillage and strip till practices for corn. Based on 2022 Iowa Custom Rates, strip till costs $21.95 less per acre and resulted in 9 bonus bushels per acre, creating a total benefit of $84.86 per acre. For a 1,000 acre farm, that adds up to more than $84,000 in total advantage - demonstrating the financial value of efficient soil management practices.
